USD/INR Price Analysis: Rising wedge, RSI retreat tease Indian rupee buyers around 79.80
- USD/INR holds lower ground inside bearish chart pattern.
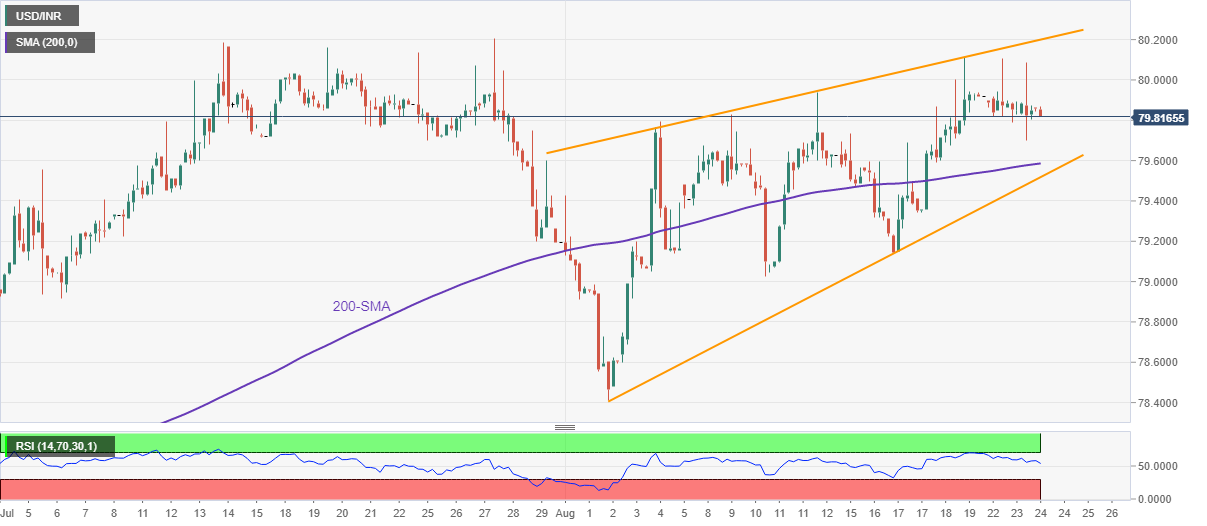
- RSI signals that bulls are running out of steam around record high.
- 200-SMA can offer an intermediate halt, 80.20 appears key upside hurdle.
USD/INR remains pressured for the third consecutive day after reversing from the monthly high, depressed around 79.82 during Wednesday’s Asian session.
In doing so, the Indian rupee (INR) pair portrays the buyer’s lack of conviction inside a three-week-old rising wedge bearish chart pattern. Also keeping the USD/INR sellers hopeful is the RSI (14) that retreats from the overbought territory.
That said, the quote’s latest weakness aims for the 200-SMA level support of 79.58 before challenging the lower line of the stated wedge, around 79.50.
Should the USD/INR pair remains weak past 79.50, it confirms (theoretically) the south-run towards 77.70. However, multiple swing lows around the 79.00 threshold and the monthly bottom surrounding 78.40 could offer intermediate halts during the anticipated fall.
Meanwhile, recovery moves the main aim for the 80.00 psychological magnet before challenging the latest high near 80.10.
Even so, the USD/INR pair’s upside momentum remains elusive until the quote stays inside the aforementioned rising wedge.
If at all the quote defies the bearish formation by crossing the 80.20 hurdle, the odds of its rally can’t be ruled out.
USD/INR: Four-hour chart
Trend: Pullback expected