WTI Price Analysis: Bulls approach $92.00 resistance confluence
- WTI crude oil prices remain firmer after bouncing off the key Fibonacci retracement support.
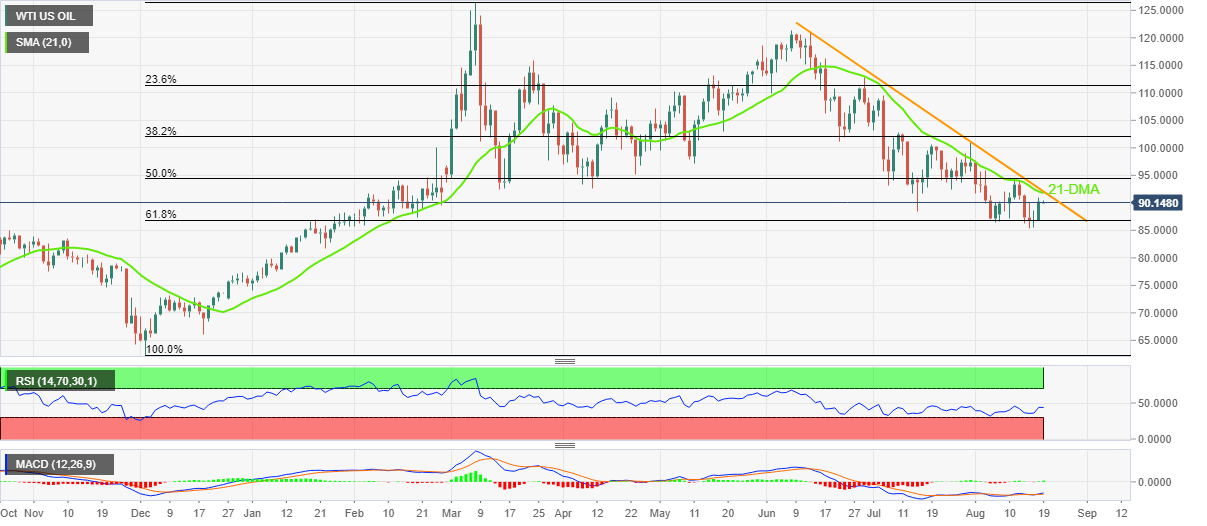
- 21-DMA, two-month-old descending trend line challenge upside momentum.
- Sluggish MACD, RSI rebound adds to the trading filters.
The price of WTI crude oil remains firmer around the weekly top, picking up bids to $90.30 during Friday’s Asian session.
That said, the black gold portrayed the biggest daily gains in a month the previous day while bouncing off the 61.8% Fibonacci retracement level of December 2021 to March 2022 upside, around $86.85 by the press time.
It’s worth noting, however, that the quote remains below a convergence of the 21-DMA and a downward sloping resistance line from mid-June, around $92.00. Also portraying the lack of upside momentum is the recently steady RSI and sluggish MACD signals.
Hence, the crude oil buyers should wait for a daily closing beyond $92.00 before lauding the latest success. Following that, a run-up towards the latest July swing high near $101.00 can’t be ruled out.
On the contrary, the aforementioned key Fibonacci retracement level surrounding $86.85 precedes the recent multi-month low, marked on Tuesday around $85.40, to restrict the short-term WTI downside.
In a case where energy bears keep reins below $85.40, the late January 2022 high near $81.70 may act as an intermediate halt before directing the prices towards the $80.00 threshold.
WTI: Daily chart
Trend: Further upside expected