Gold Price Forecast: Battle lines well-mapped for XAUUSD ahead of key event risks – Confluence Detector
- Gold Price consolidates the rebound, not out of the woods yet.
- Markets remain risk-averse amid Beijing lockdown fears, Fed rate hikes.
- US dollar index closes in on 102.00, holds near two-year highs.
Nothing much has changed fundamentally for Gold Price over the past 24 hours, although bulls are seeing some temporary reprieve. The bearish potential remains intact for XAUUSD, as the US dollar holds near two-year highs vs. its main rivals. Markets remain cautious and prefer to seek refuge in the US currency amid rising worries over the Fed’s aggressive tightening stance and Beijing's covid lockdown, which may temper the global economic recovery. Traders now await the US economic releases for fresh dollar valuations, eventually impacting Gold Price.
Also read: Gold Price Forecast: XAUUSD remains exposed to $1,880 on hawkish Fed bets
Gold Price: Key levels to watch
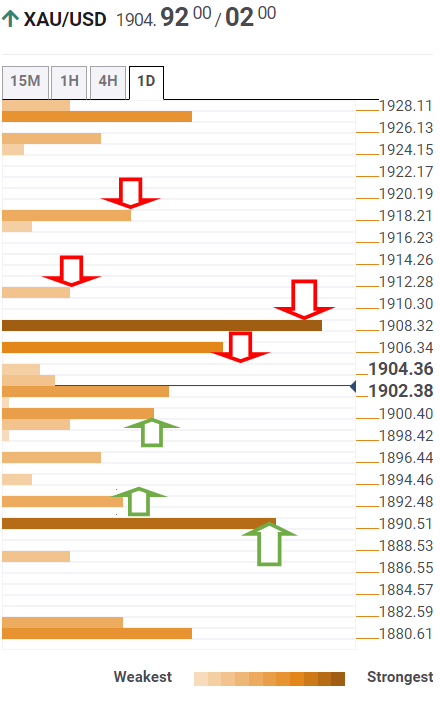
The Technical Confluences Detector shows that Gold Price is stuck in a narrow range despite the rebound, as the pivot point one-week S1 at $1,906 limits the immediate upside.
If that level is scaled, then bulls need to yield a decisive break above $1,909, the confluence of the Fibonacci 38.2% one-day and the previous high four-hour.
The next stop for XAUUSD bulls is envisioned at the SMA10 four-hour at $1,911. Further up, the convergence of the Fibonacci 61.8% one-day and SMA200 15-minutes at $1,918 will be eyed.
On the downside, $1,900 acts as powerful support, where the Bollinger Band one-day Lower lies.
Should bears take out that downside cap, then a retest of the daily lows at $1,896 will be inevitable.
The previous day’s low of $1,892 will be next on the sellers’ radars. The line in the sand for Gold buyers is the previous month’s low at $1,890.
Here is how it looks on the tool
About Technical Confluences Detector
The TCD (Technical Confluences Detector) is a tool to locate and point out those price levels where there is a congestion of indicators, moving averages, Fibonacci levels, Pivot Points, etc. If you are a short-term trader, you will find entry points for counter-trend strategies and hunt a few points at a time. If you are a medium-to-long-term trader, this tool will allow you to know in advance the price levels where a medium-to-long-term trend may stop and rest, where to unwind positions, or where to increase your position size.