WTI Price Analysis: Bears look set for 200-HMA retest
- WTI keeps pullback from multi-day top, retreats of late.
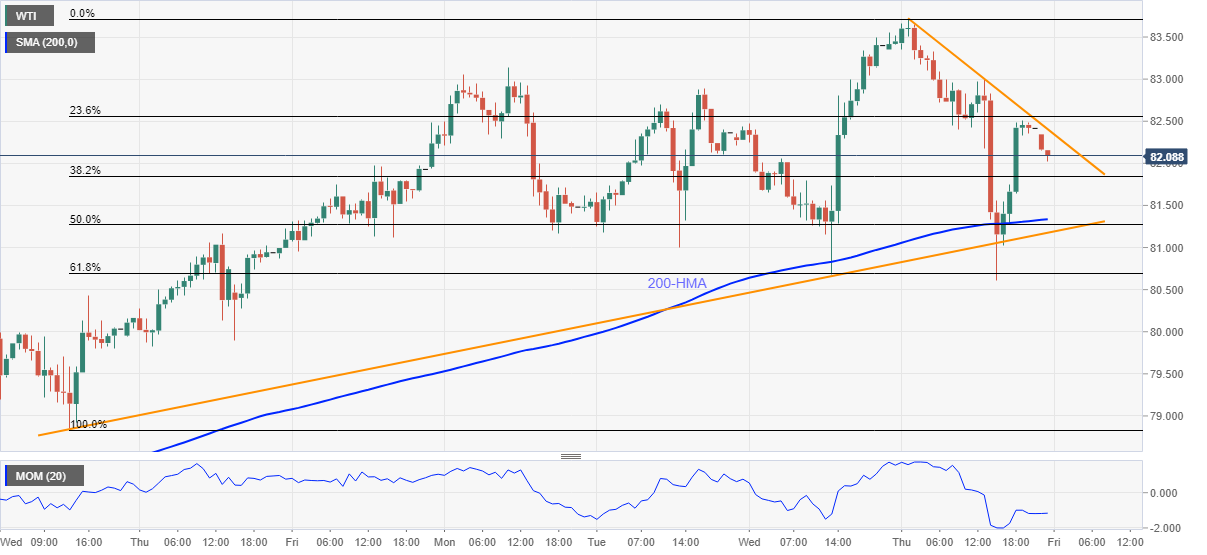
- Immediate falling trend line, downbeat Momentum line favor sellers.
- Weekly support line adds to the downside filters.
WTI fades late Thursday’s bounce off $80.60, following its U-turn from a seven-year high, during Friday’s Asian session. That said, the quote drops back to $82.00 by the press time.
The black gold tracks a nearby descending trend line, coupled with a falling Momentum line, to suggest further weakness.
However, 200-HMA and an upward sloping support line, respectively around $81.30 and $81.10, challenge short-term declines of the commodity prices.
Also acting as a downside filter is the 61.8% Fibonacci retracement of October 13-21 upside, near $80.70, as well as the $80.00 psychological magnet.
Alternatively, an upside break of the nearby resistance line, around $82.40 at the latest, will recall the WTI buyers and direct them to the latest top surrounding $83.70.
Though, Monday’s top near $83.15 and multiple lows marked during November 2012 near $84.10-20 act as extra resistances to watch during the quote’s fresh upside.
WTI: Hourly chart
Trend: Further weakness expected