Gold Price Forecast: XAU/USD eyes $1818 and $1823 as the next bullish targets – Confluence Detector
- Gold extends gains above the $1810 mark amid DXY’s pullback.
- Gold awaits Fed Powell’s speech for hints on taper timing.
- Gold Weekly Forecast: XAU/USD bulls bet on Golden Cross pattern, uptrend support, lower yields
Gold price is back is holding onto the recent upbeat momentum above $1800, having witnessed an up and down session a day before. The US inflation surged to the highest level in 13 years last month and reignited Fed’s hawkish expectations, boosting the US dollar across the board at gold’s expense. However, mounting Delta covid strain concerns and US stimulus optimism kept the gold bulls motivated. Heading into the Fed Chair Jerome Powell’s showdown, gold is heading back towards the previous week’s high, as the dollar bulls take a breather, awaiting fresh hints on the timing of a likely tapering.
Read: Powell Preview: Three reasons to expect the Fed Chair to down the dollar
Gold Price: Key levels to watch
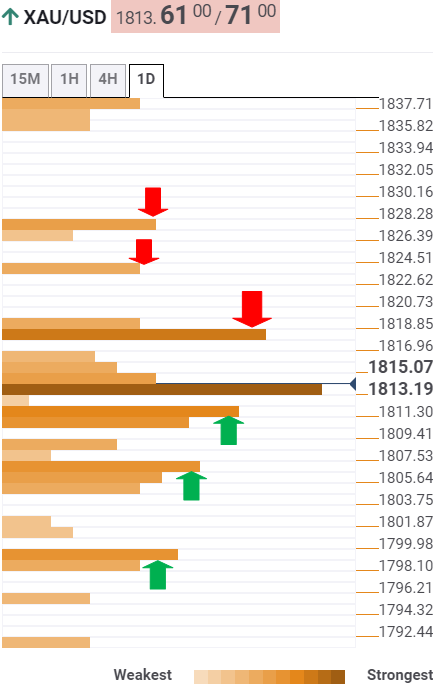
The Technical Confluences Detector shows that gold price is likely to face stiff resistance around $1818 amid renewed buying interest.
At the level, the previous week’s high and Tuesday’s high collide.
The next relevant upside barrier is seen at the pivot point one-week R1 at $1823.
The bulls will then strive to take on the confluence of the SMA200 one-day and SMA200 four-hour at $1827.
On the downside, immediate support awaits at $1810, where the Fibonacci 23.6% one-week converges with the Fibonacci 38.2% one-day and SMA10 four-hour.
Further south, a dense cluster of support levels is stacked up around $1805, which will limit the downside attempts.
That zone is the intersection of the SMA5 one-day, Fibonacci 61.8% one-day and Fibonacci 38.2% one-week.
The line in the sand for gold bulls is seen at $1799, the convergence of the previous day low and the Fibonacci 61.8% one-week.
Here is how it looks on the tool
About Technical Confluences Detector
The TCD (Technical Confluences Detector) is a tool to locate and point out those price levels where there is a congestion of indicators, moving averages, Fibonacci levels, Pivot Points, etc. If you are a short-term trader, you will find entry points for counter-trend strategies and hunt a few points at a time. If you are a medium-to-long-term trader, this tool will allow you to know in advance the price levels where a medium-to-long-term trend may stop and rest, where to unwind positions, or where to increase your position size.