15 Apr 2021
US Dollar Index Price Analysis: Extra losses look likely near-term
- DXY’s downside flirts with lows in the mid-91.00s.
- Next on the downside is located the 91.30 area.
The downtrend in DXY remains unabated, picking up extra pace following the recent break below the critical 200-day SMA in past sessions.
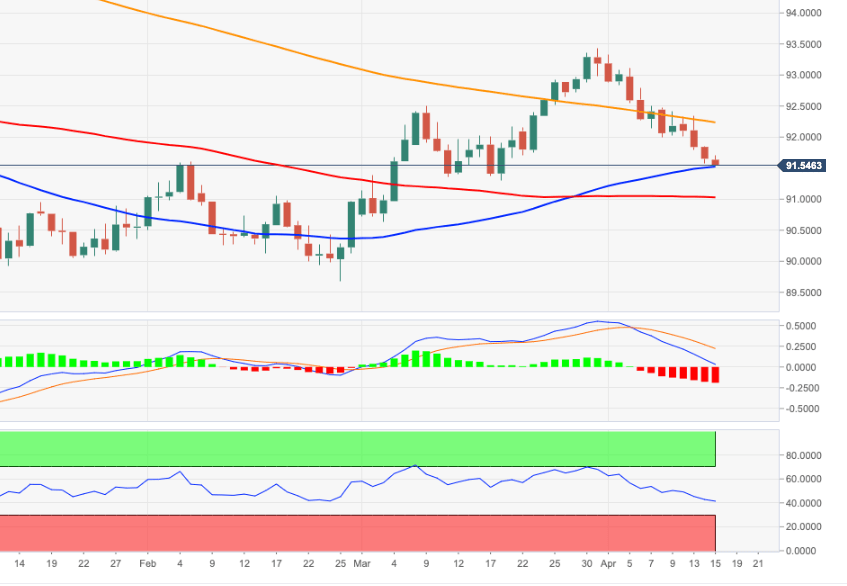
That said, a sustainable breach of the 50-day SMA near 91.60 should pave the way for the continuation of the selling bias with the next target emerging around 91.30, where sit weekly lows recorded in mid-March.
Below the 200-day SMA (92.23) the outlook for DXY is expected to remain on the bearish side.
DXY daily chart