19 Nov 2020
US Dollar Index Price Analysis: Bullish attempt seen short-lived
- DXY regains some composure and reaches tops around 92.70/75.
- Further downside remains likely with the next target near 91.70.
DXY reverses a 5-session negative streak and climbs to the 92.70/75 band, or new 3-day highs in the second half of the week.
In spite of the ongoing bullish attempt, the broader focus still remains on the downside. That said, extra losses are initially targeting the monthly low at 92.13 (November 9) ahead of the 2020 low at 91.74 (September 1).
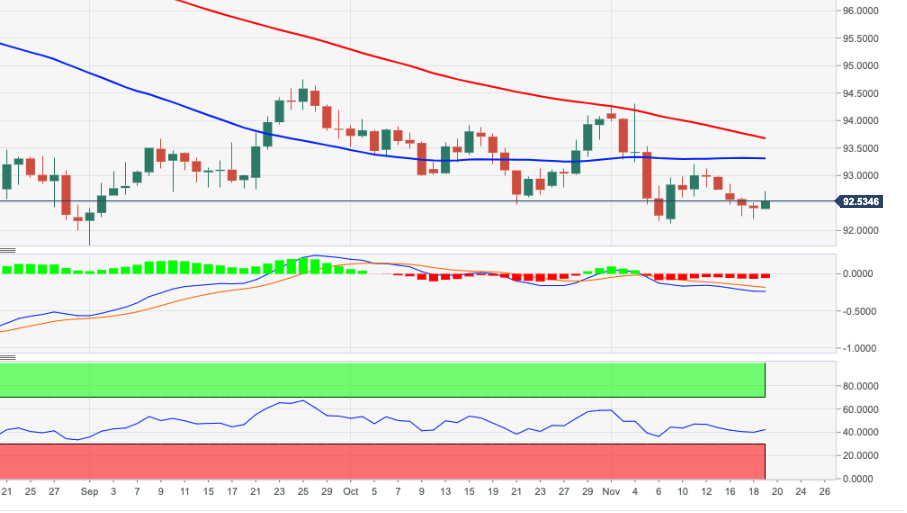
In the near-term, the selling pressure is seen alleviating somewhat above weekly highs at 9320 (November 11). Further out, as long as DXY trades below the 200-day SMA, today at 96.24, the negative view is forecast to persist.
DXY daily chart