17 Apr 2020
S&P 500 Price Analysis: US stocks trading in 5-week highs, bullish
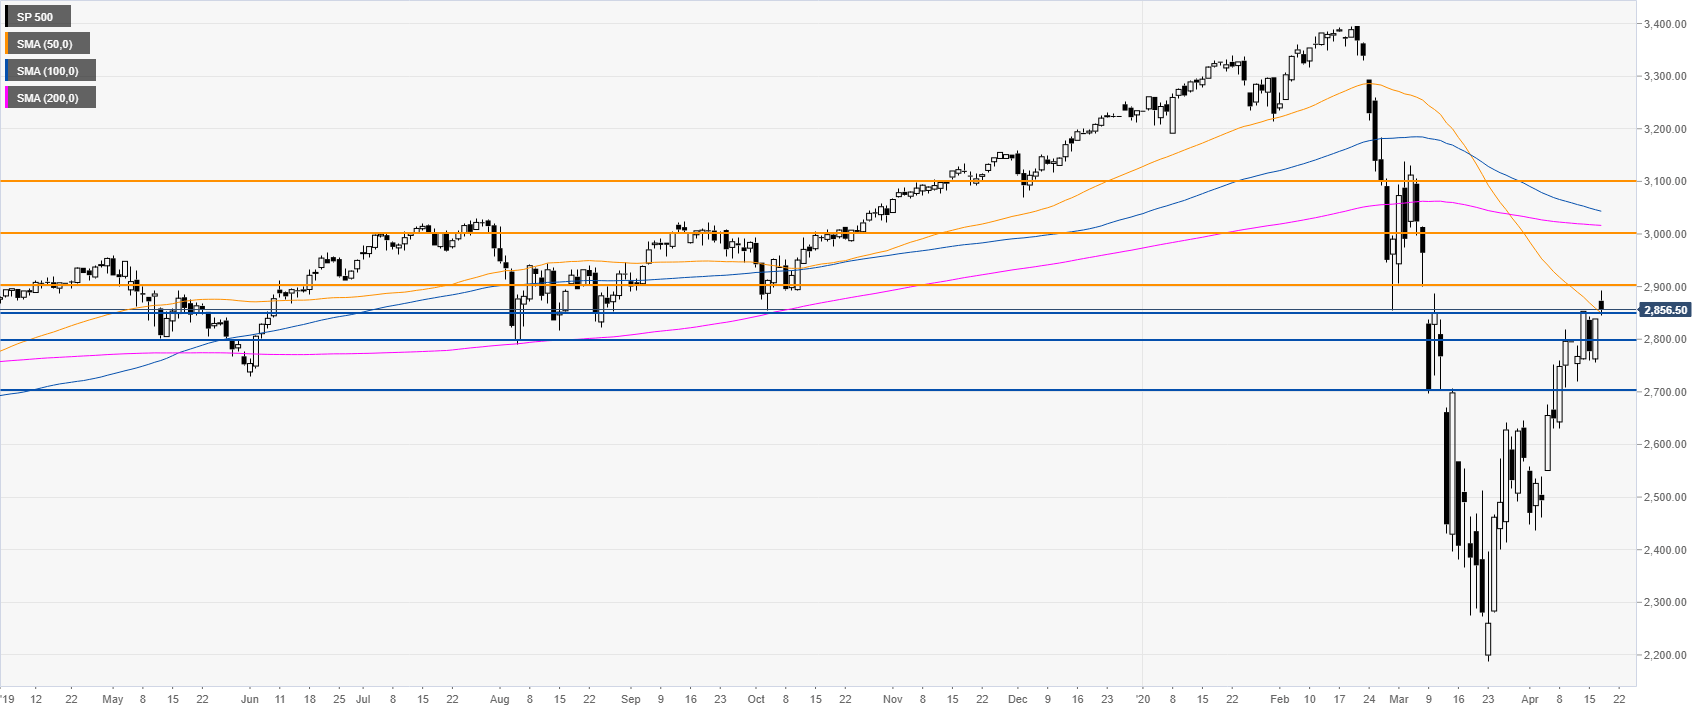
- S&P 500 index is trading in 5-week highs challenging the 50 SMA on the daily chart.
- The bullish recovery stays intact as buyers overcame the 2800/2850 resistance zone.
S&P 500 daily chart
The S&P 500 remains firmly bullish making higher highs and higher lows as the buyers overcame the 2800/2850 resistance zone. The market remains biased to the upside with bulls setting their eyes on the 3000 round number. On the flip side, the 2800/2850 price zone is expected to act as support.
Additional key levels