16 Oct 2019
USD/JPY technical analysis: Greenback sidelined against Yen, holding at multi-week highs
- Brexit optimism and positive US-China trade talks are lessening the demand for the safe-haven Yen.
- USD/JPY is holding stable this Wednesday above the 108.56 level.
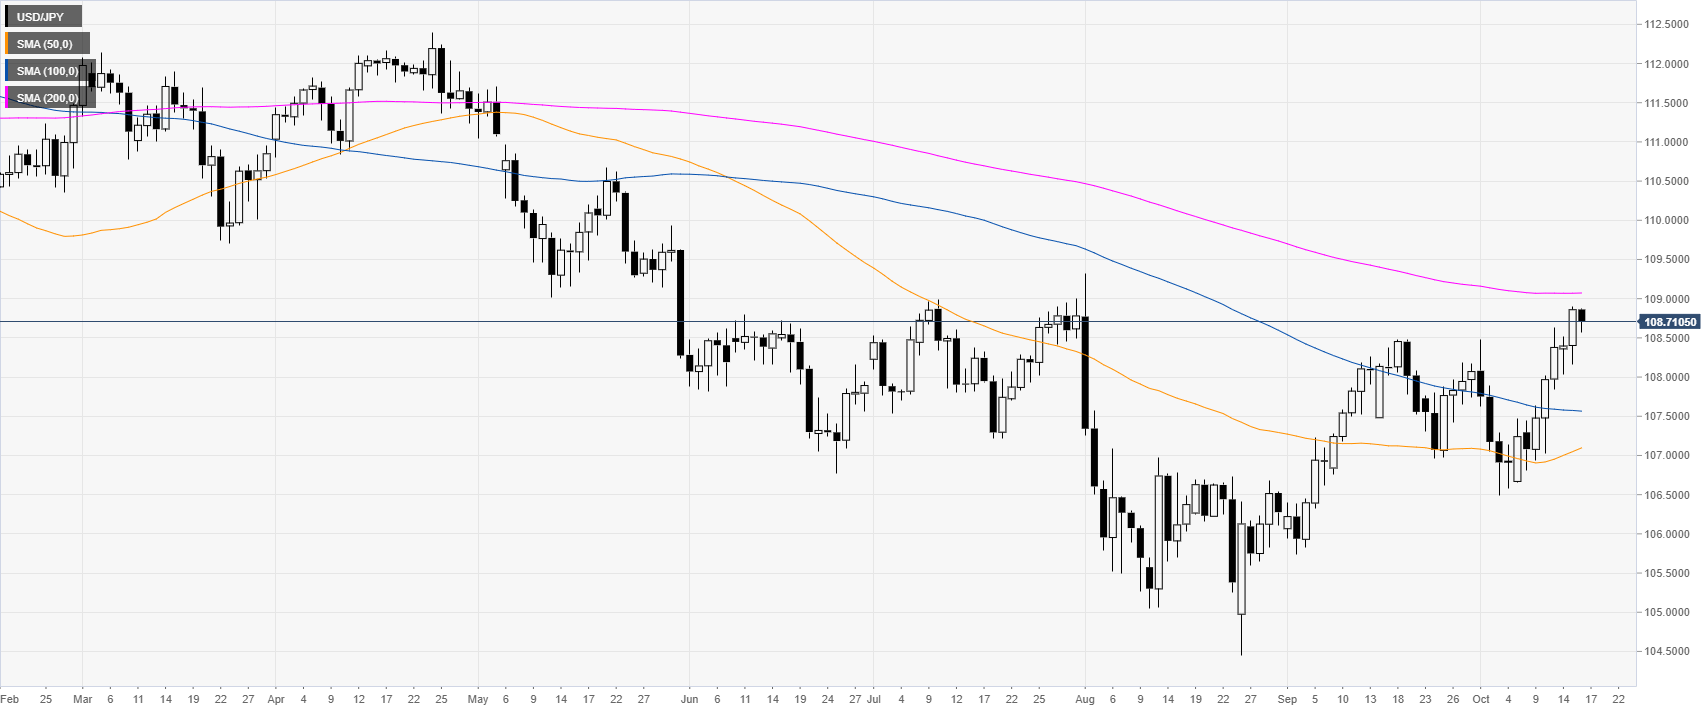
USD/JPY daily chart
USD/JPY is trading in a downtrend below its 200-day simple moving average (DSMA). However, the spot has been bouncing sharply from the October lows and is now trading close to two-month highs. Optimism over Brexit and the US-China trade is lessening the demand for the safe-haven Yen.
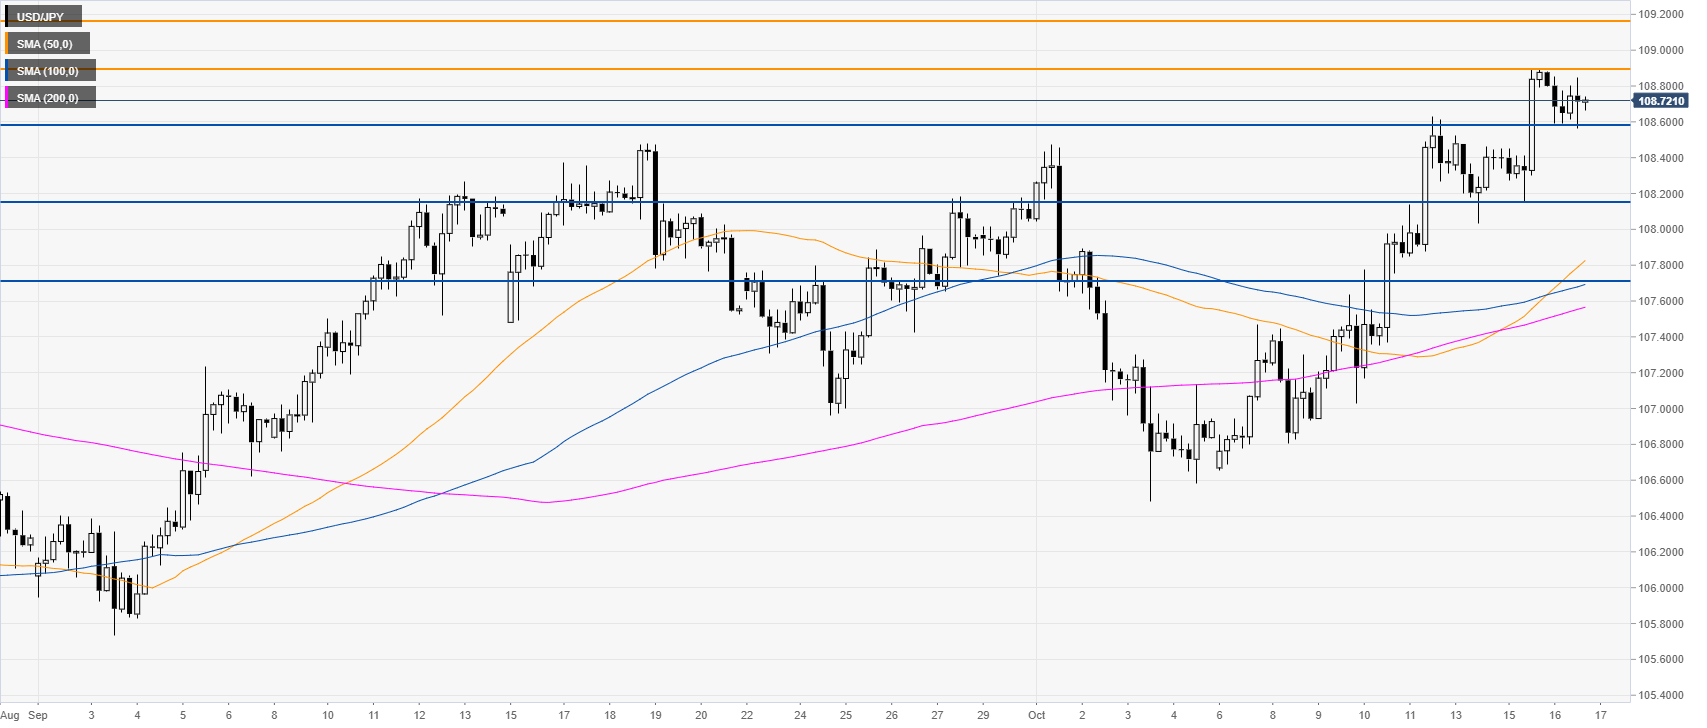
USD/JPY four-hour chart
USD/JPY is trading above its main SMAs on the four-hour chart, suggesting a bullish bias in the medium term. A daily close above the 108.56 resistance could open the doors to the 109.18 price level, according to the Technical Confluences Indicator.
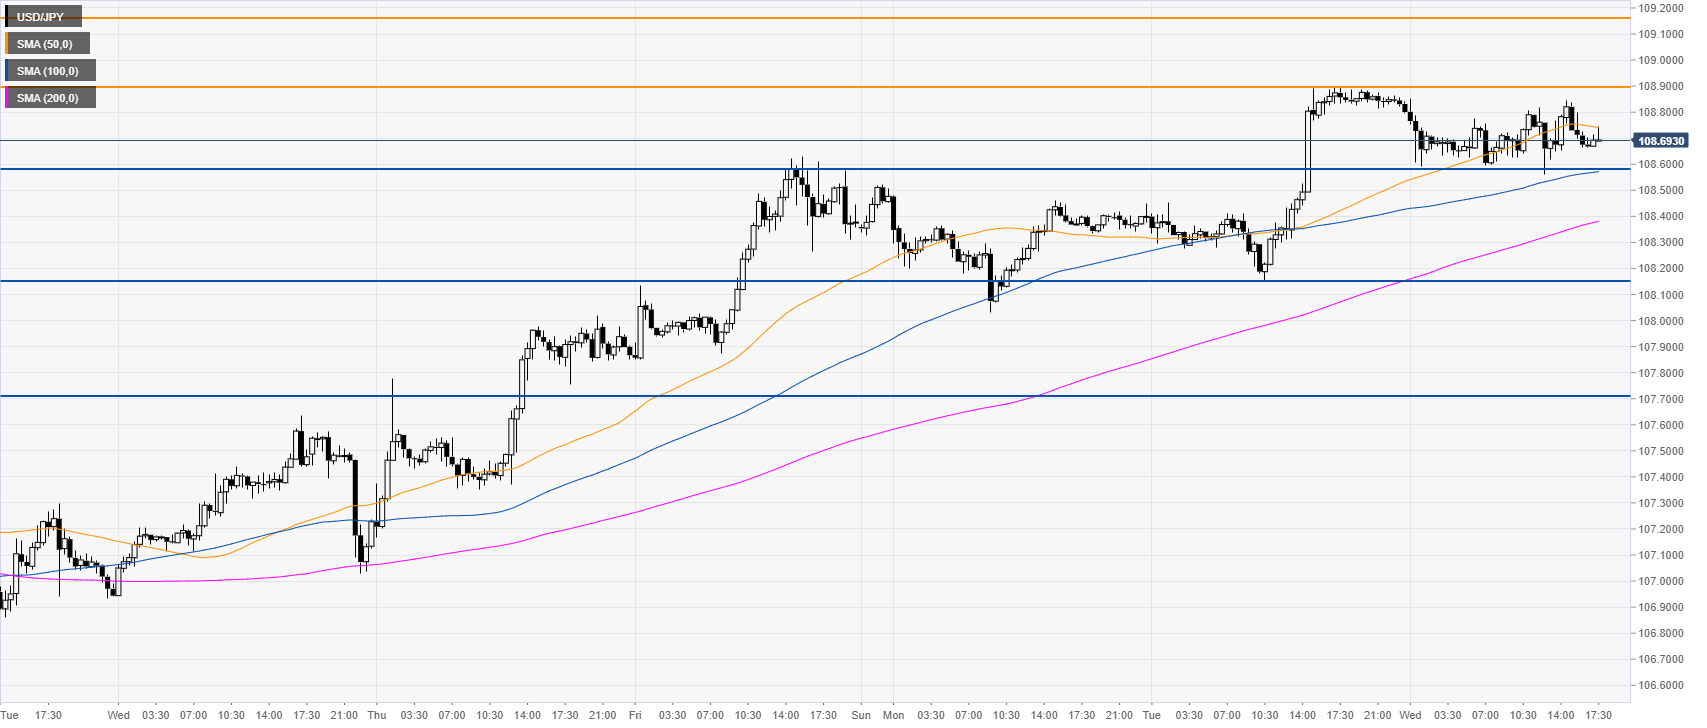
USD/JPY 30-minute chart
USD/JPY is trading above the 100 and 200 SMAs, suggesting bullish momentum in the near term. Immediate supports are seen at the 108.56 and 108.16 price levels, according to the Technical Confluences Indicator.
Additional key levels