GBP/USD technical analysis: Sellers await entry below near-term rising trendline, 200-day SMA
- GBP/USD declines from a five-month high.
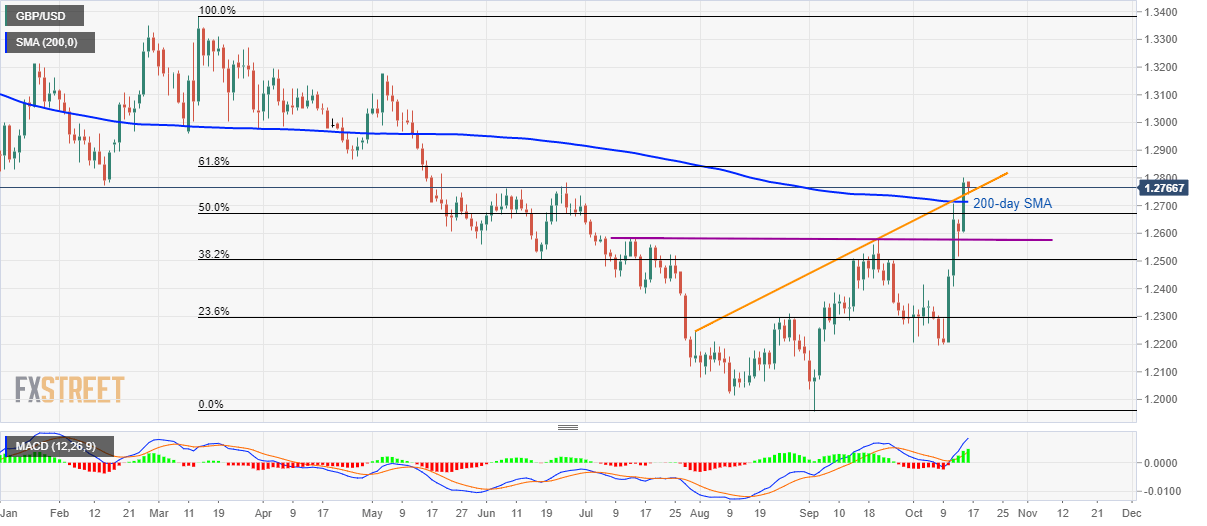
- A rising trend-line since July-end, 200-day SMA act as immediate key support.
- 61.8% Fibonacci retracement could please buyers during further upside.
Despite the failure to rise beyond May-end top, the GBP/USD pair stays above the key supports as it traders near 1.2750 while heading into the London open on Wednesday.
The pair needs to decline below an upward sloping trend-line since July-end, at 1.2745, adjacent to 200-day Simple Moving Average (SMA) level of 1.2714, in order to revisit 1.2585/80 horizontal support comprising mid-July highs and September month top.
Given the bears’ dominance past-1.2580, 38.2% Fibonacci retracement of March-September declines, at 1.2505 could become their favorite.
On the upside break above 1.2800, 61.8% Fibonacci retracement, at 1.2840, will please bulls whereas April month low nearing 1.2865 and 1.2900 round-figure might be their targets afterward.
GBP/USD daily chart
Trend: bullish