25 Jun 2019
US Dollar Index Technical Analysis: The index is expected to hold the downside around 95.80
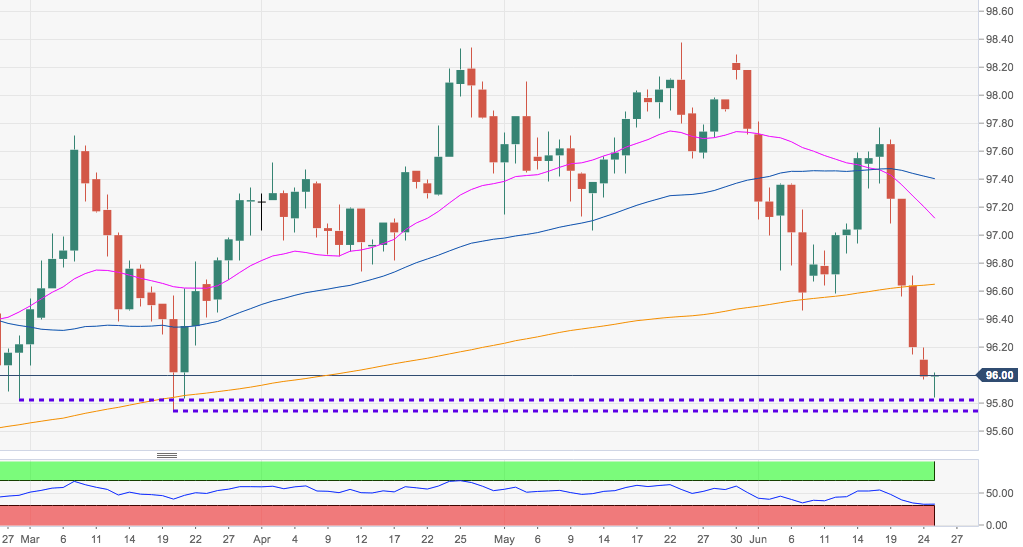
- The correction lower in the buck is showing no signs of exhaustion. On the contrary, it gathered further pace after breaking below the key 200-day SMA, the multi-month support line and the 96.00 handle.
- The sharp decline has so far met decent contention in the 95.80 region, where emerges late February lows ahead of March 20 low at 95.74.
- In case bulls regain the upper hand, the initial target emerges at the 96.55/60 band, where converge the 200-day SMA and the now resistance line.
DXY daily chart