3 Jun 2019
USD/JPY technical analysis: Perfect storm as greenback weakens and yen strengthens
- USD weakens as the market is starting to price in a rate cut.
- Yen is strengthening as the trade war favors the safe-haven Japanese currency.
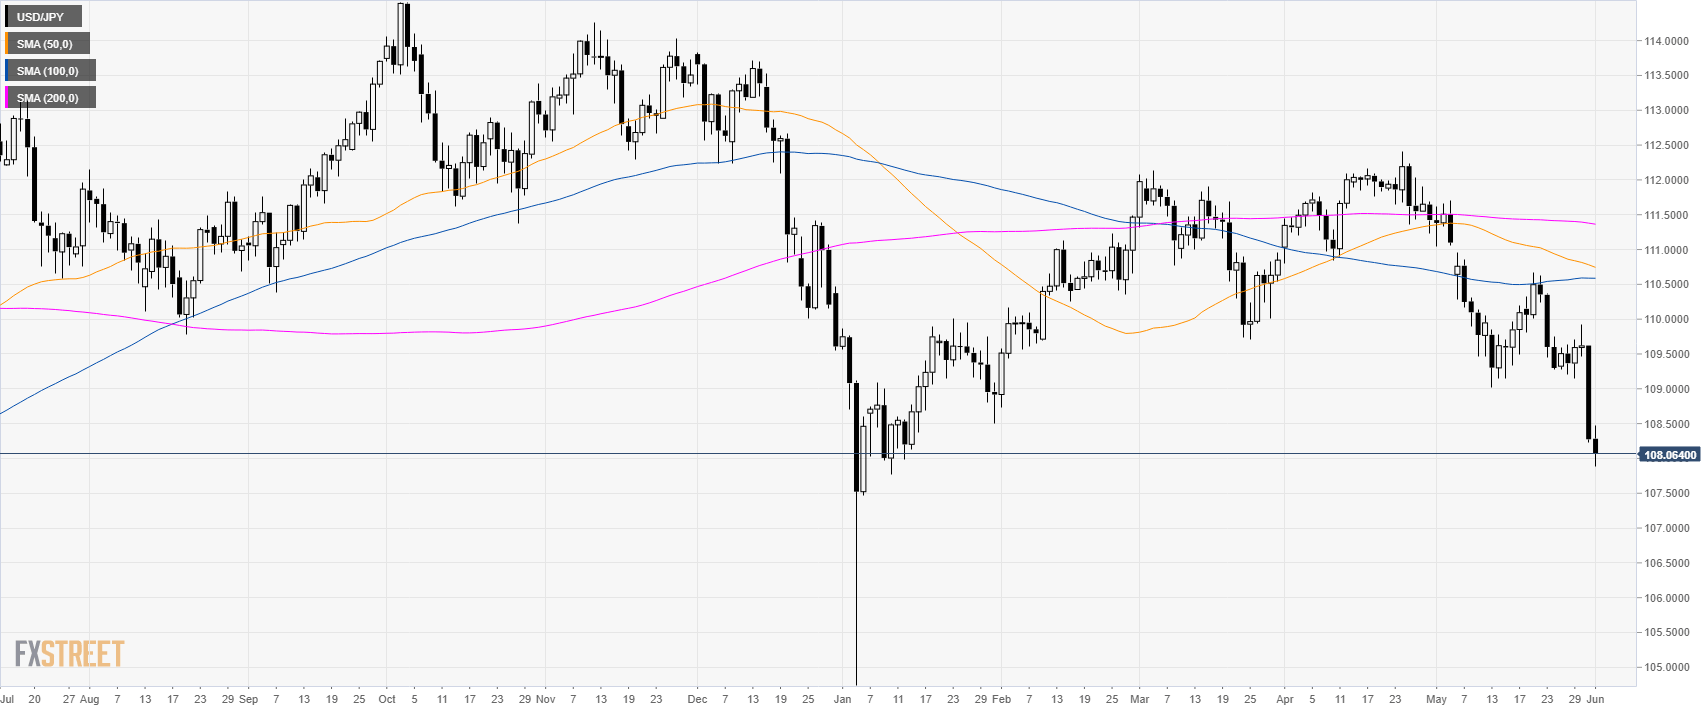
USD/JPY daily chart
USD/JPY is trading in a bear leg below its main simple moving averages (SMAs) now testing 108.00.
USD/JPY 4-hour chart
USD/JPY is under pressure below its main SMAs.

USD/JPY 30-minute chart
USD/JPY is trading below its main SMAs suggesting bearish pressure in the near term. Bears want to drive the market below 107.70 to reach 107.30. To the upside, resistance is seen at 108.06 and 108.50.

Additional key levels