15 May 2019
USD/CAD technical analysis: Greenback gets rejected at the 1.3500 figure one more time
- CAD is gaining momentum as crude oil is up on on Wednesday. CAD is correlated to oil.
- The 1.3500 figure is a tough nut to crack and buyers have not been able to pierce through it yet.
USD/CAD daily chart
USD/CAD stays trapped in the 1.3400-1.3500 range while the market trades above its main simple moving averages (SMAs).

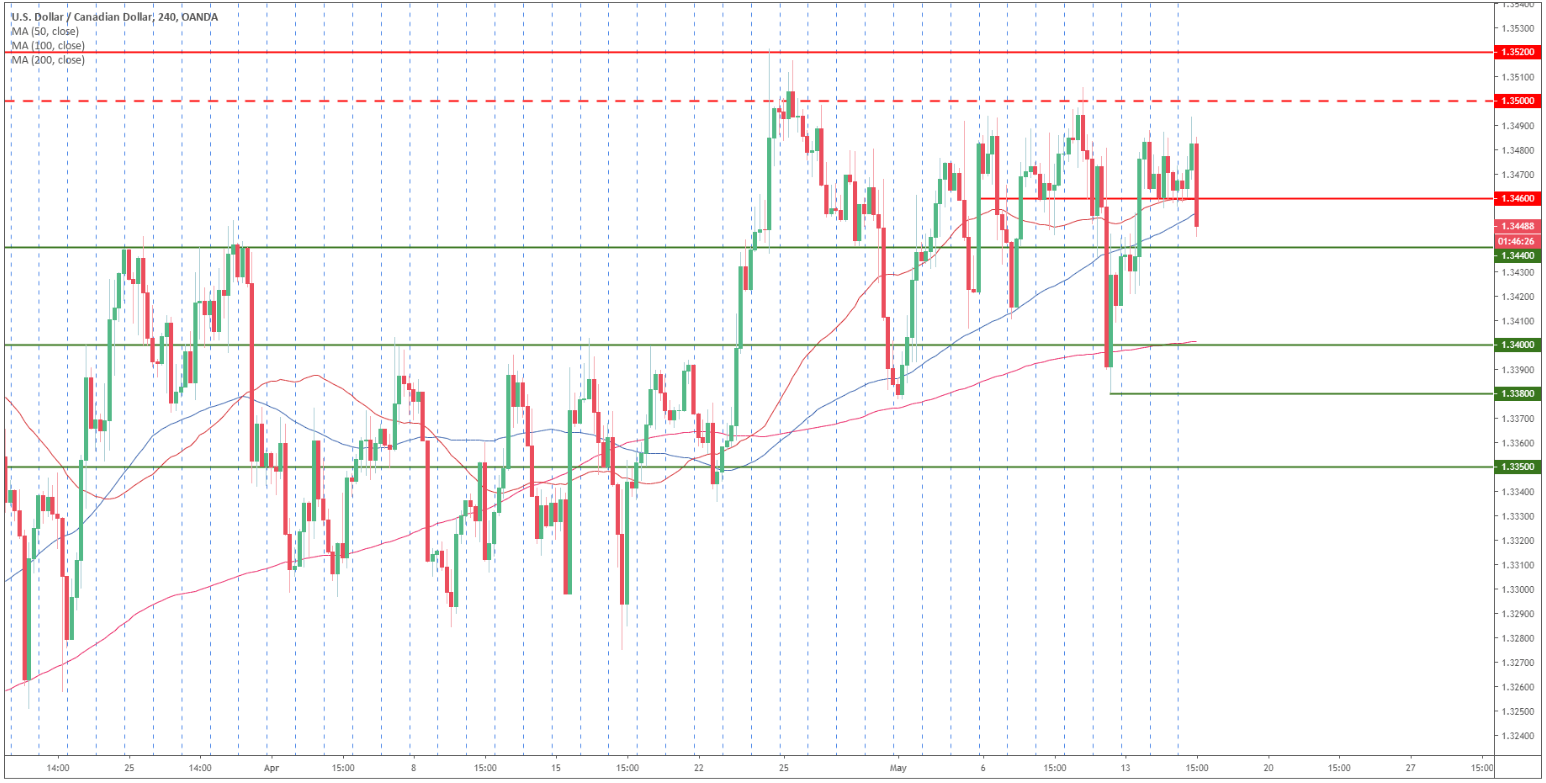
USD/CAD 4-hour chart
The market is rejecting once again the 1.3500 figure.
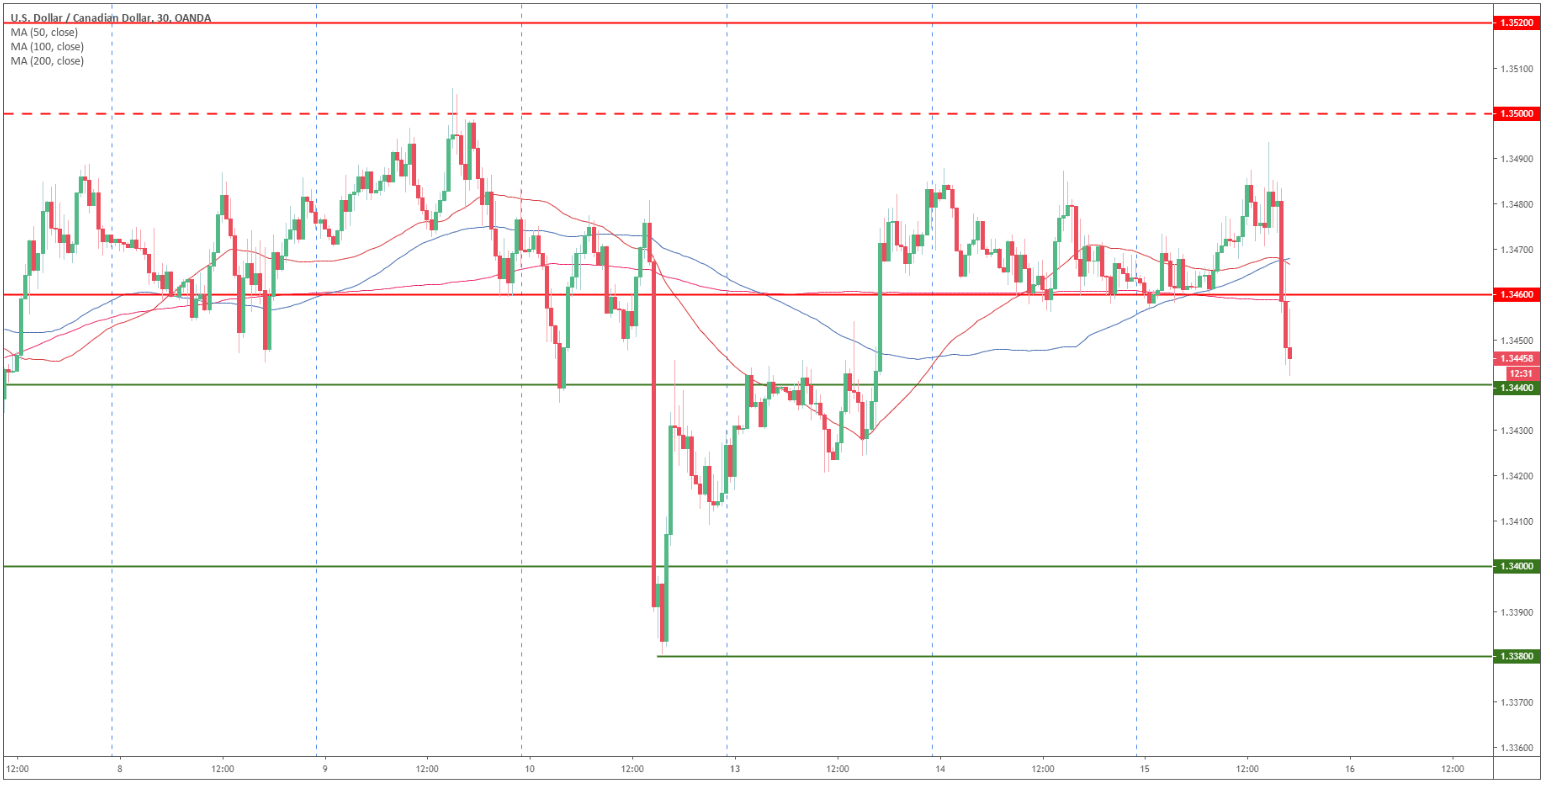
USD/CAD 30-minute chart
USD/CAD seems set to remain contained in a tight range between 1.3440 and 1.3500 figure. However, if sellers manage to break below 1.3440 the market might dive down to 1.3400 the figure.
Additional key levels