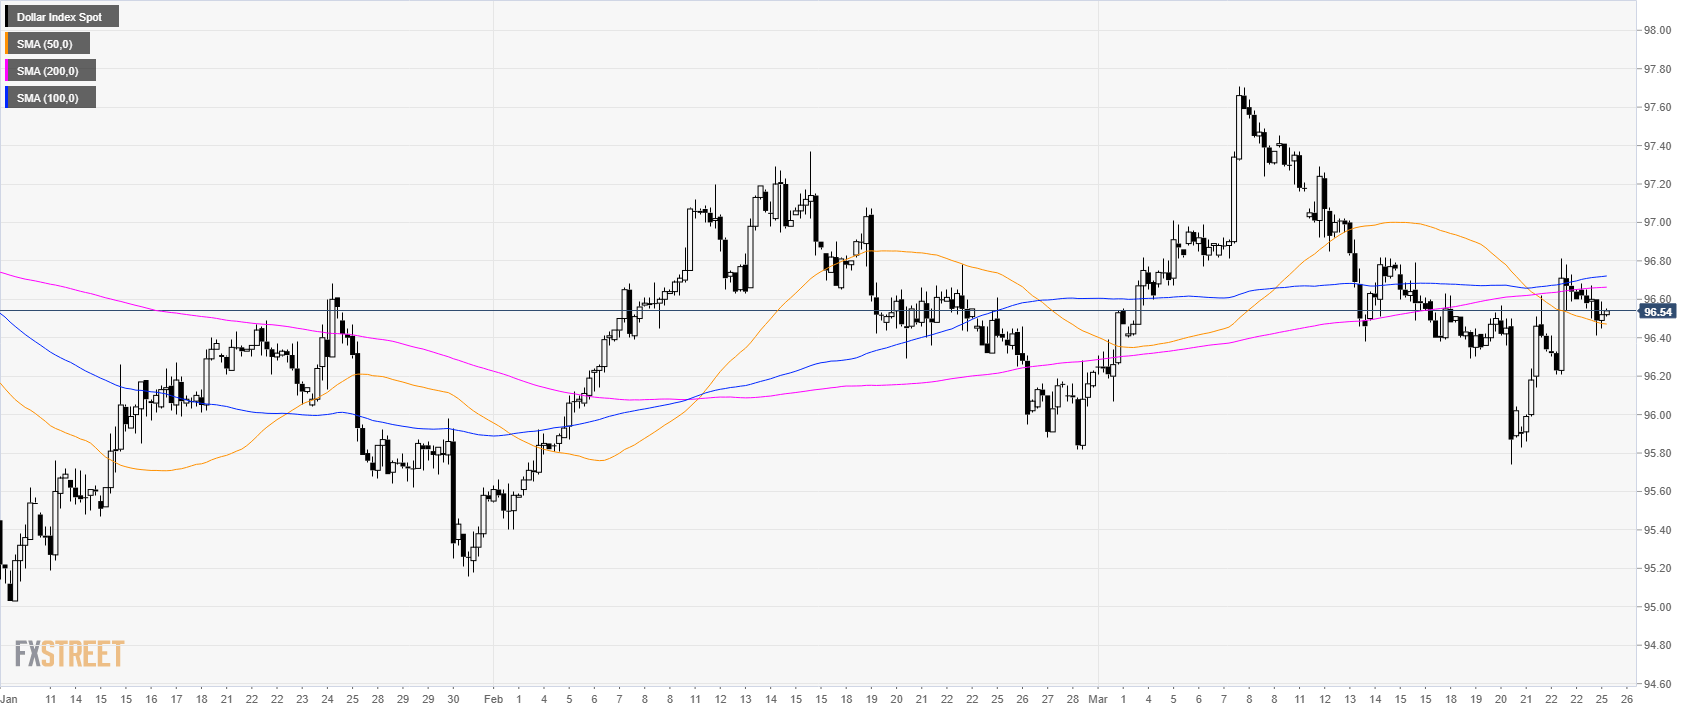
US Dollar Index Technical: Greenback bulls hold the market above 96.30 support

DXY daily chart

  • The US Dollar Index (DXY) is trading in a bull trend above its 200-day simple moving average (SMA).
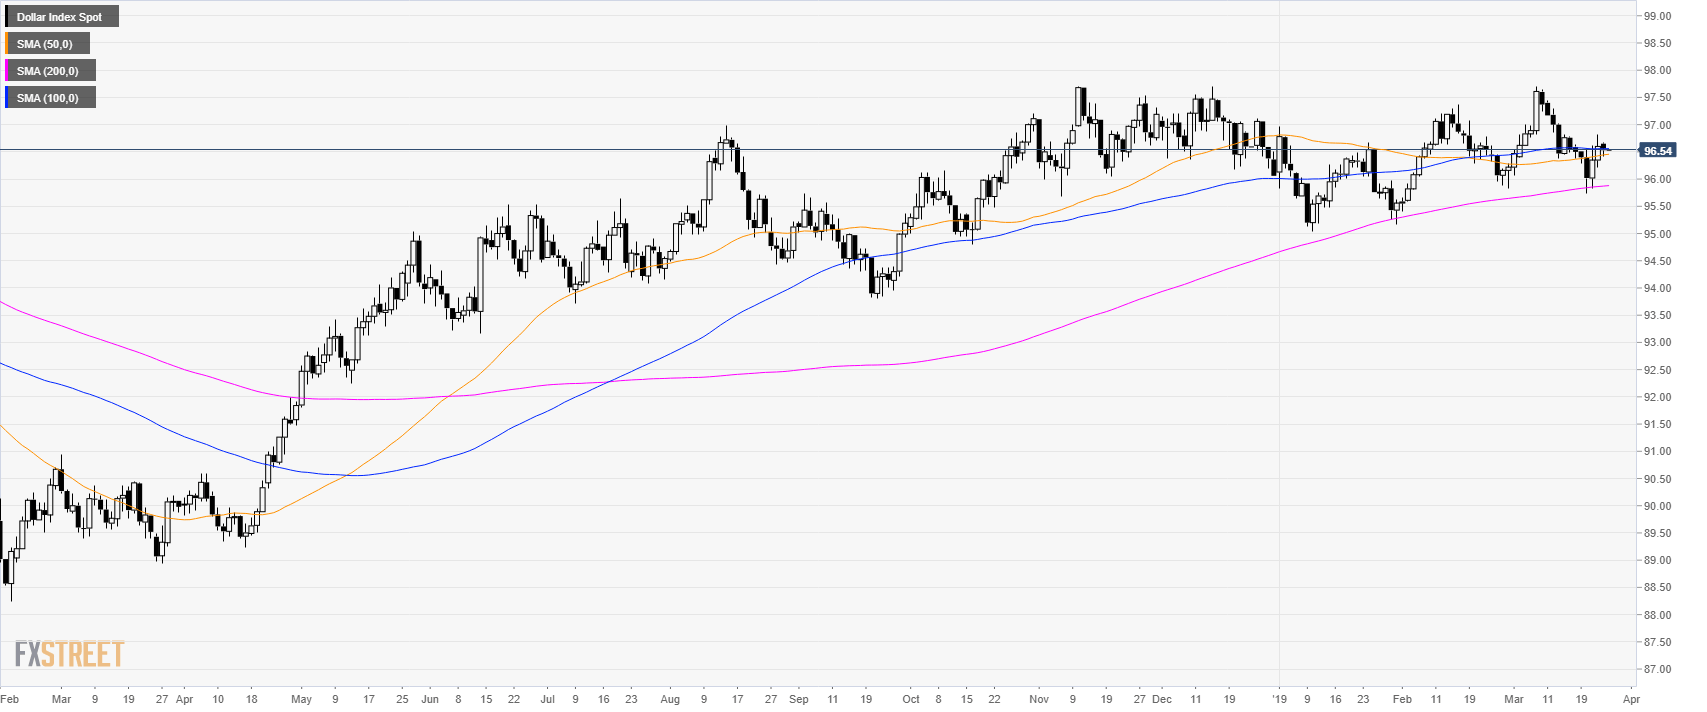

DXY 4-hour chart

  • DXY is bouncing from 95.80 support.


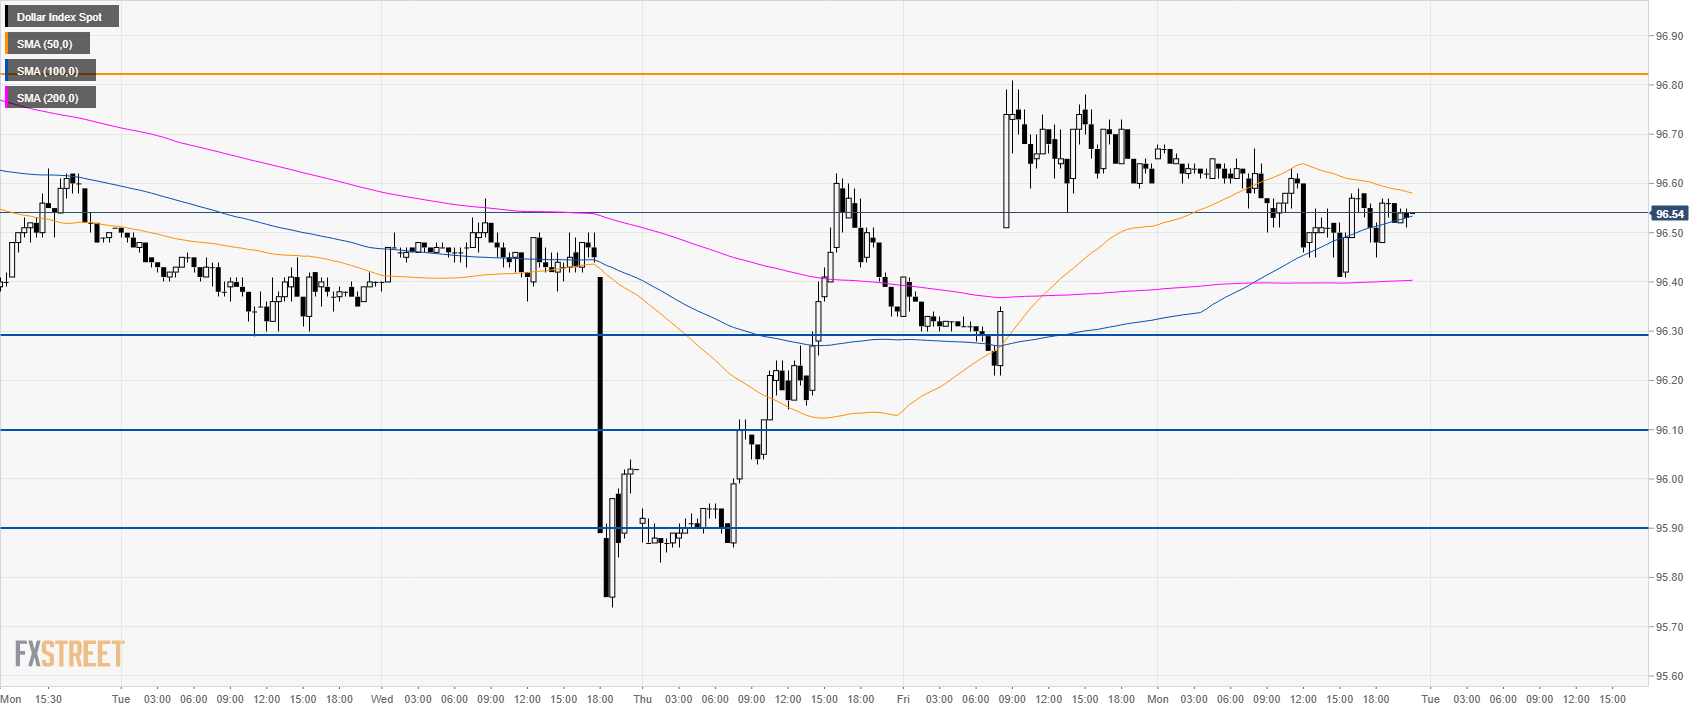
DXY 30-minute chart

  • DXY is trading above the 100 and 200 SMAs suggesting bullish momentum in the short-term.
  • 96.80, 97.00 and 97.40 can become the next resistances to the upside.
  • Support is at 95.30, 96.10 and 95.90 level.

Additional key levels


NZD/USD: On bid around 0.6910 despite mixed New Zealand trade balance as export growth gained major attention

NZD/USD is taking bids near 0.6910 at the start of Tuesday’s Asian trading. February month New Zealand trade balance figures strengthened the quote du
Mehr darüber lesen Previous

Brexit voting underway: Letwin Amendment Yes 329 vs No 302

Three amendments to May's plan are being voted upon: Amendment A, also known as the Letwin amendment, which seeks to take control of parliament and
Mehr darüber lesen Next