10 Oct 2018
USD/CAD Technical Analysis: Breakout above 1.3000 figure can be a game-changer as bulls retake the helm
- USD/CAD broke strongly above the 1.3000 figure and the 200-period simple moving average switching the main bias to bullish.
- USD/CAD is now finding resistance at the 1.3050 resistance as a pullback down can be in the making. Bulls should ideally keep the market above 1.2950 (multi-month key level) in order to prevent a reversal down and a continuation of the bull trend.
- Targets to the upside in the coming days can be located near 1.3108 (September 7 low) and 1.3200 figure.
USD/CAD 4-hour chart
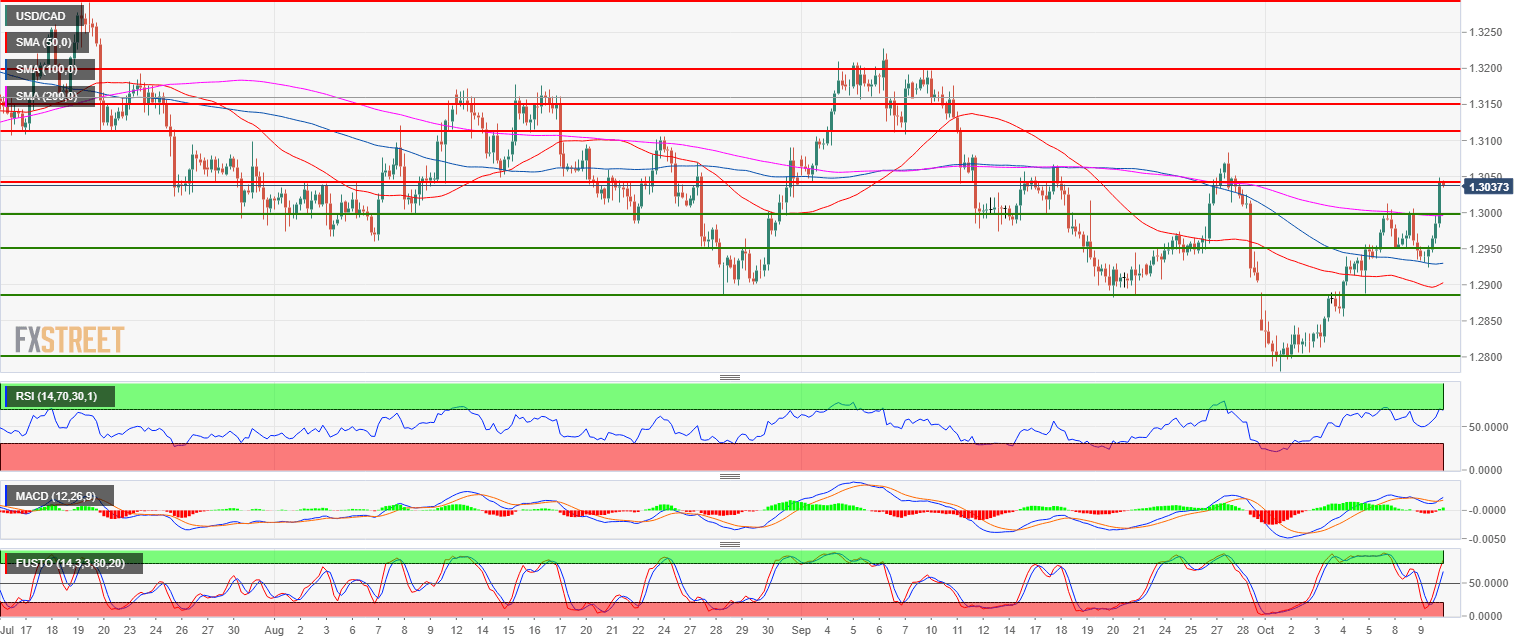
Spot rate: 1.3013
Relative change: 0.54%
High: 1.3018
Low: 1.2926
Main trend: Bullish
Resistance 1: 1.3048 August 14 low
Resistance 2: 1.3108, September 7 low
Resistance 3: 1.3200 figure
Support 1: 1.3000 figure
Support 2: 1.2950-59 multi-month key level and August 7 low
Support 3: 1.2882-1.2900 September 20 low and figure
Support 4: 1.2855-65 June 6 low - 200-day SMA
Support 5: 1.2800 figure
Support 6: 1.2727 May 11 low