USD/JPY Technical Analysis: Any meaningful pull-back might be seen as a buying opportunity
• The pair extended its retracement slide from levels just above the 112.00 handle, or six-week tops, and eroded a part of previous session's strong up-move.
• The pull-back could be solely attributed to a weaker tone surrounding the USD, albeit risk-on mood/positive US bond yields helped limit deeper losses.
• The pair, so far, has managed to hold comfortably above important short-term moving averages - 50, 100 & 200 SMAs, on the 1-hourly chart and thus, remains poised to resume the positive momentum.
• Yesterday's strong up-move beyond a short-term descending trend-line hurdle add credence to the constructive outlook and now seems to act as a key trigger for bullish traders.
• Meanwhile, technical indicators on the mentioned chart have started losing positive momentum and might turn out to be the only factor prompting some further weakness.
USD/JPY 1-hourly chart
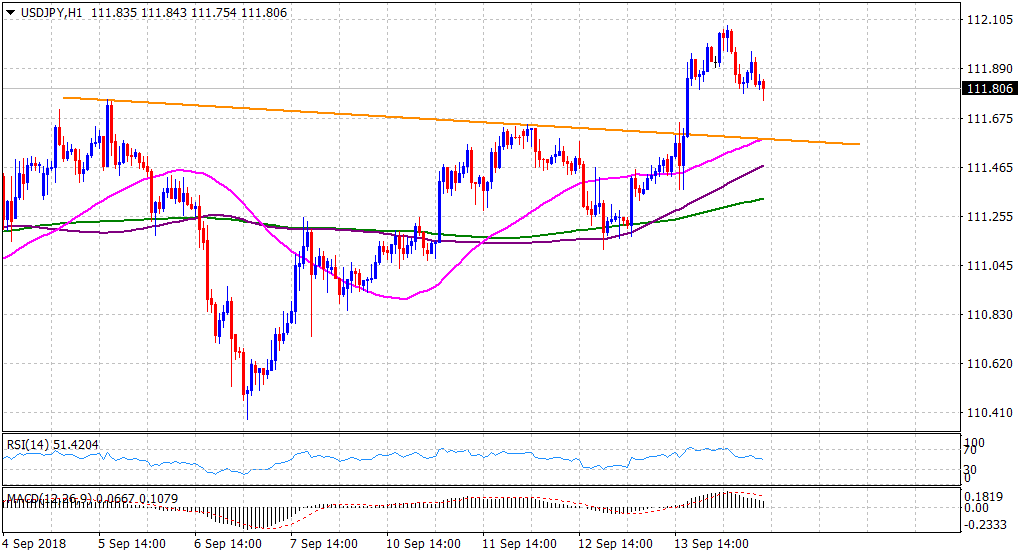
Spot Rate: 111.81
Daily High: 112.08
Daily Low: 111.81
Trend: Bullish
Resistance
R1: 112.15 (Aug. 1 high)
R2: 112.53 (R2 daily pivot-point)
R3: 113.00 (round figure mark)
Support
S1: 111.59 (descending trend-line resistance break-point)
S2: 111.34 (50-day SMA)
S3: 111.00 (round figure mark)