USD/CAD Technical Analysis: Bears patiently waiting for a drop to 1.2960 level
- USD/CAD is consolidating the main uptrend since June 27 as bulls are unable to print new highs.
- USD/CAD is breaking below the ascending bull trendline opening the doors to 1.2959 August 7 swing low.
- A sustained bull breakout above 1.3120-1.3155 area would negate the short-term bearish bias.
USD/CAD daily chart
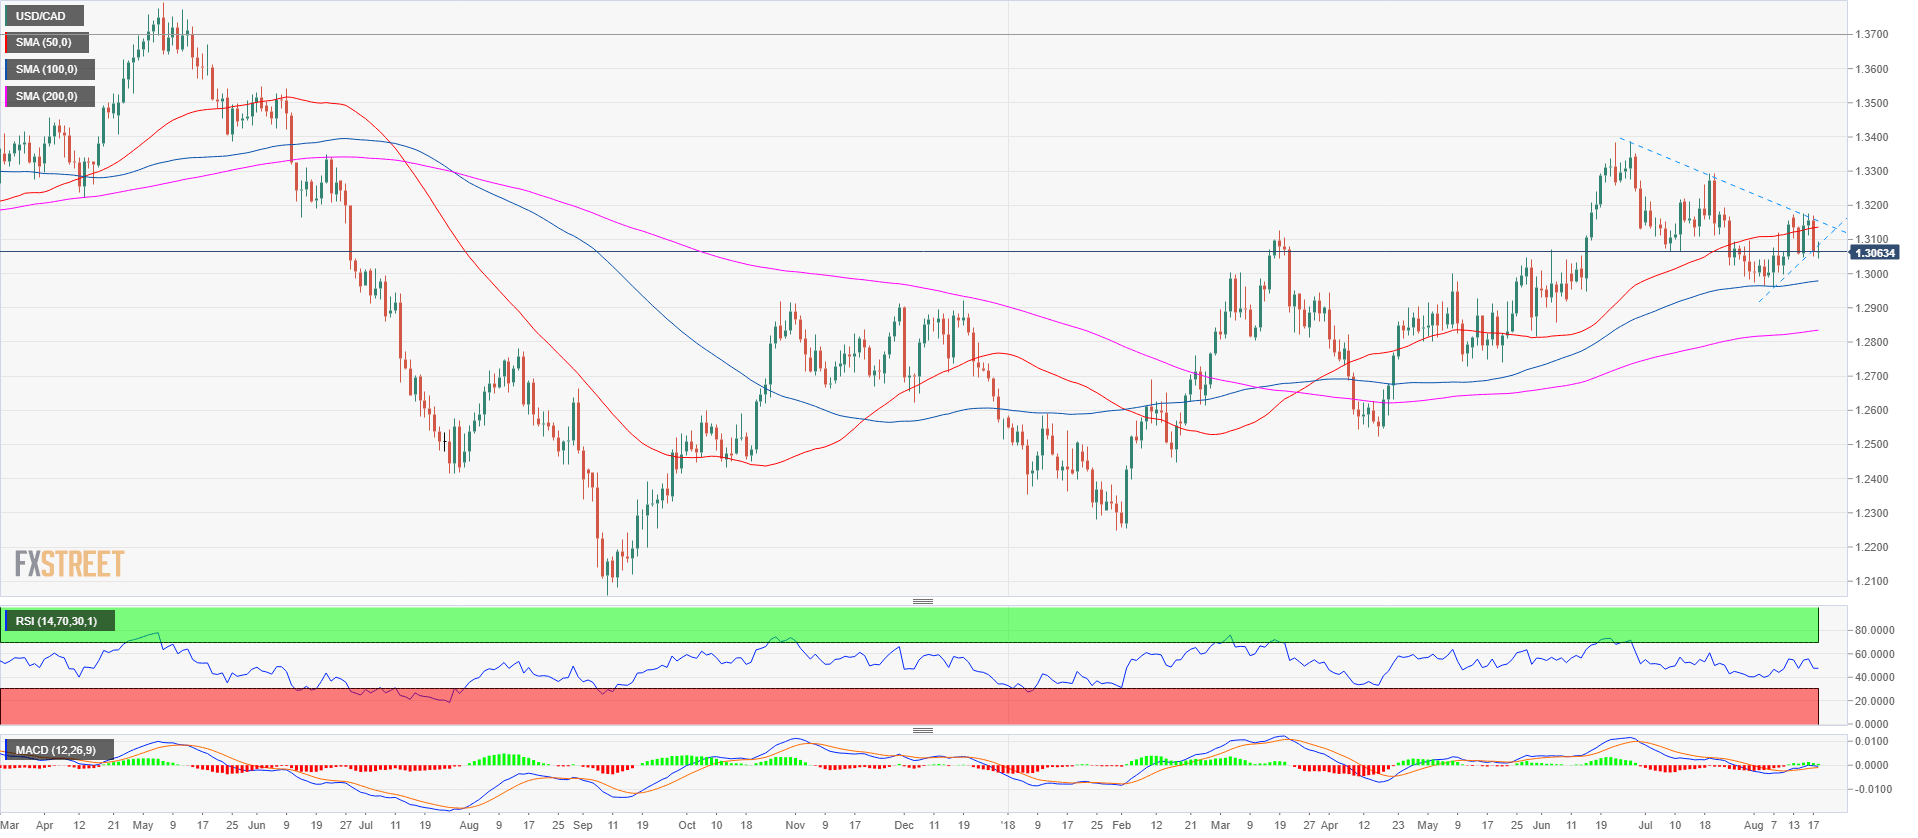
Spot rate: 1.3062
Relative change: -0.01%
High: 1.3094
Low: 1.3045
Trend: Bullish
Short-term Trend: Bearish below 1.3120-1.3155 area.
Resistance 1: 1.3100 figure
Resistance 2: 1.3120-1.3155 area, supply/demand level and June 18 low
Resistance 3: 1.3172 August 13 swing high
Resistance 4: 1.3200 figure
Resistance 5: 1.3271 June 29 high
Resistance 6: 1.3350 figure
Resistance 7: 1.3388, 2018 high
Resistance 8: 1.3543 June 9, 2017 swing high
Support 1: 1.3048-1.3066 area, August 14 low and July 9 low
Support 2: 1.3022 July 25 low
Support 3: 1.3000 figure
Support 4: 1.2959 August 7 swing low
Support 5: 1.2900 figure
Support 6: 1.2855 June 6 low