EUR/USD Technical Analysis: manages to hold above YTD lows, for the moment
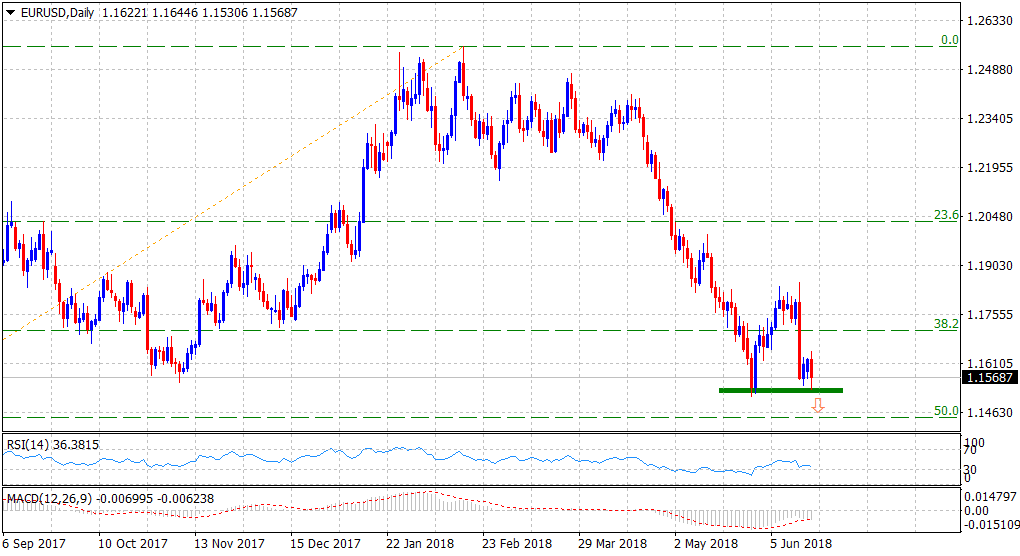
• Tumbles closer to YTD lows reached in May, albeit managed to rebound a bit back above mid-1.1500s.
• A convincing break below recent lows should pave the way for another leg of decline to the 1.1450-55 region.
• The mentioned support marks 50% Fibonacci retracement level of the up-move from December 2016 to multi-year highs touched earlier this year.
• A sustained recovery back above the 1.1600 handle might negate any bearish outlook and trigger a short-covering bounce in the near-term.
EUR/USD daily chart
Current Price: 1.1569
Daily High: 1.1645
Daily Low: 1.1531
Trend: Bearish below 1.1510 level
Resistance
R1: 1.1600 (round figure mark)
R2: 1.1620 (horizontal zone)
R3: 1.1645 (current day swing high)
Support
S1: 1.1510 (multi-month lows set on May 29)
S2: 1.1479 (July 20, 2017 swing low)
S3: 1.1450 (50% Fibo. Retracement level)