17 May 2023
USD/CAD Price Analysis: Bulls eye a break of daily trendline resistance
- USD/CAD bulls eye support near a 50% mean reversion and a 61.8% Fibonacci area.
- Bulls need to break 1.3500 and daily trendline resistance.
At the time of writing, USD/CAD is trading around the 1.3480s and rallied from a low of 1.3404 overnight. There are prospects of a run to test the 1.3500 resistance, considering the price is now on the back side of the prior bearish micro trend.
USD/CAD H1 chart
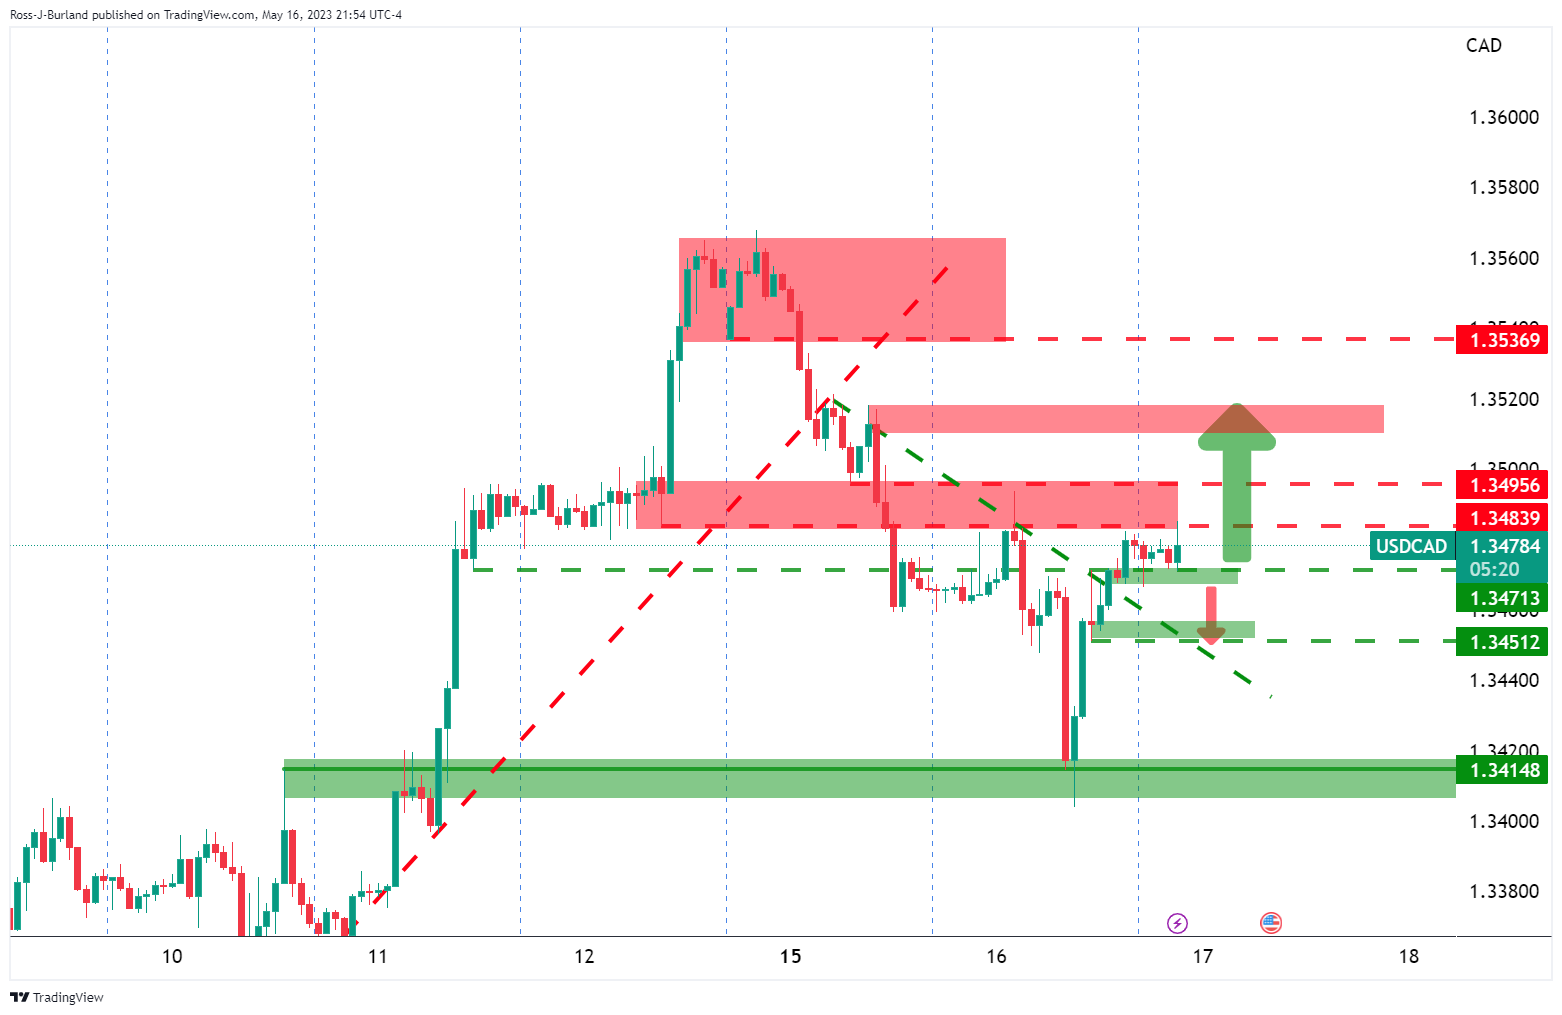
However, if the bears commit to resistance, there will be prospects of a move to restest the now counter-trendline support and the 1.3450s.
On the daily chart, below, such a move would tally with a 50% mean reversion support and below there, a 61.8% Fibonacci area around the 1.3420 and trendline support:
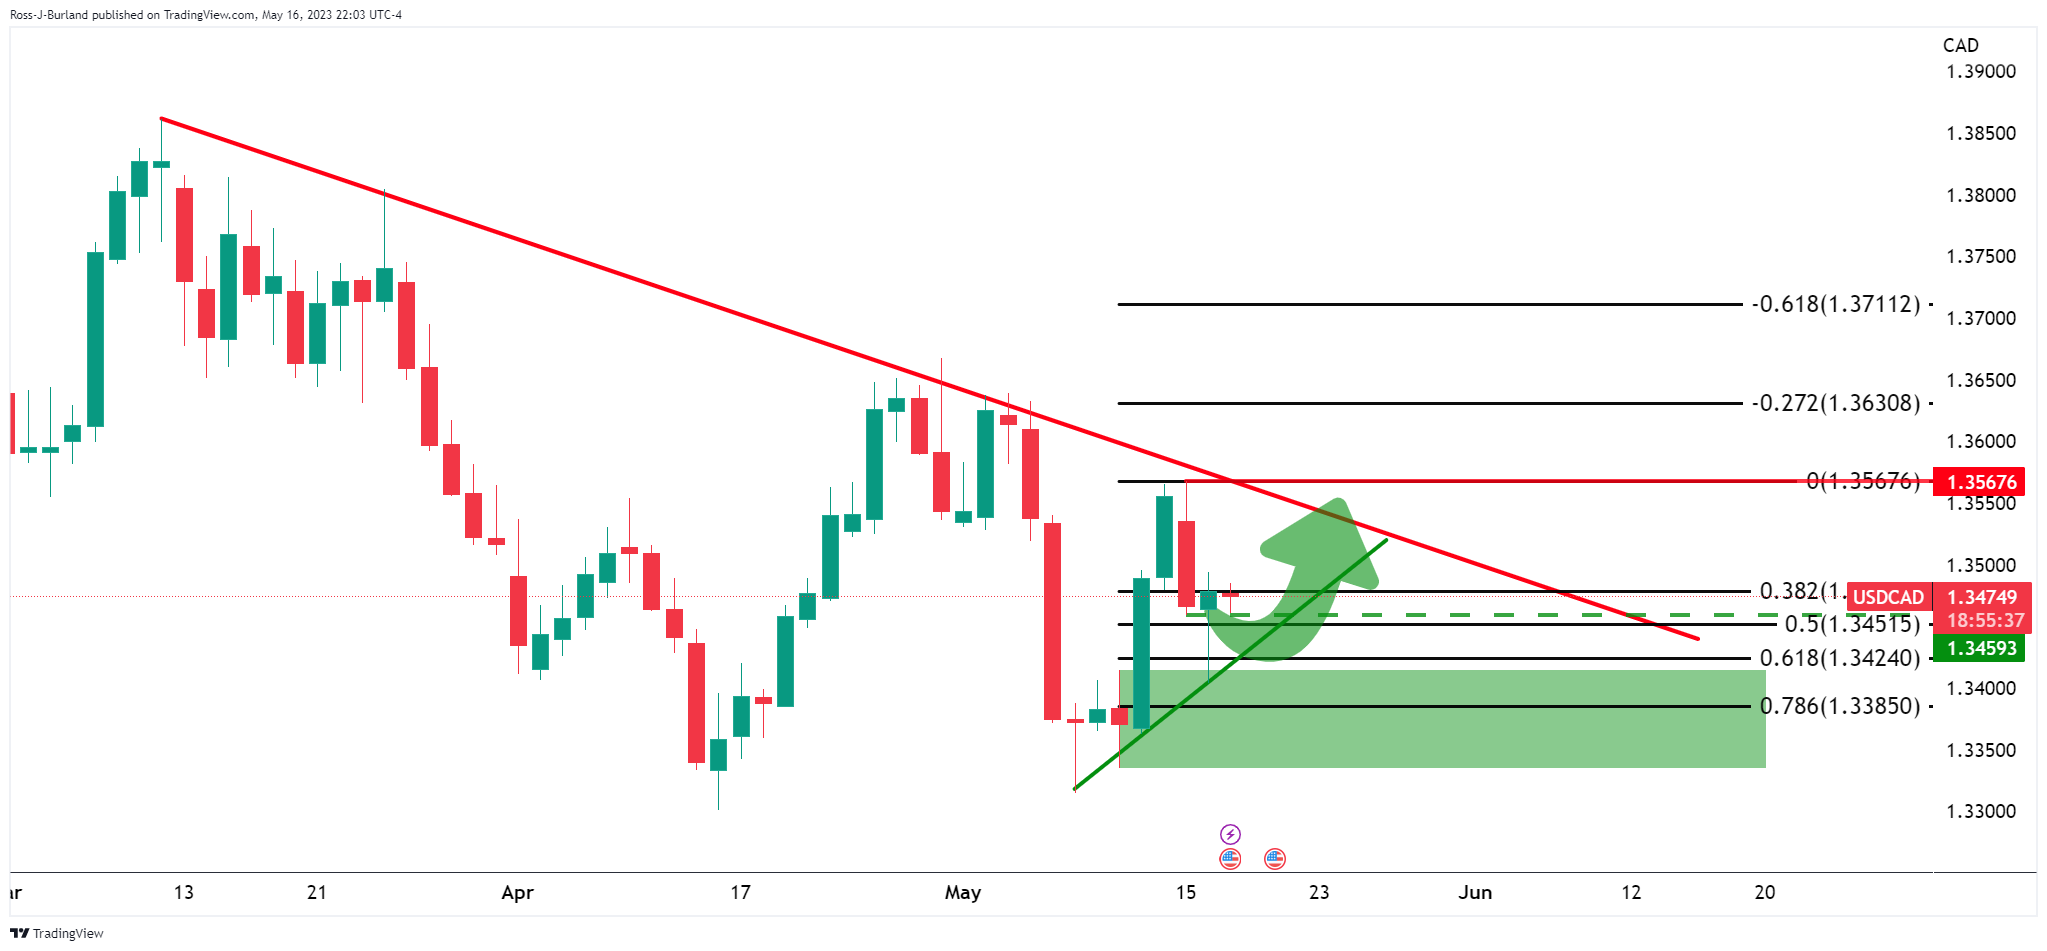
If the bulls commit, then there will be prospects of a move through the daily trendline resistance.