9 May 2023
WTI Price Analysis: Bulls and bears go head to head at a critcal zone on the charts
- WTI bulls eye a break of $73.90 to the upside.
- Bears need a break of the $71.70s to the downside in order to resume the broader downtrend.
As per the prior analysis, WTI bears are lurking in what could be a peak formation on the charts, the oil price has taken on resistance and is now at a critical juncture as the bulls flex their muscles. WTI is sandwiched between $73.90 on the backside of a longer-term bearish trend and the backside of a micro counter trend as the following illustrates:
WTI H4 chart, prior analysis

It was argued that the resistance of the trendline and horizontal $73.90 could play a role in a subsequent sell-off in the coming sessions. A break of $73.90, however, opened the risk of a move towards the $76.70s.
WTI updates

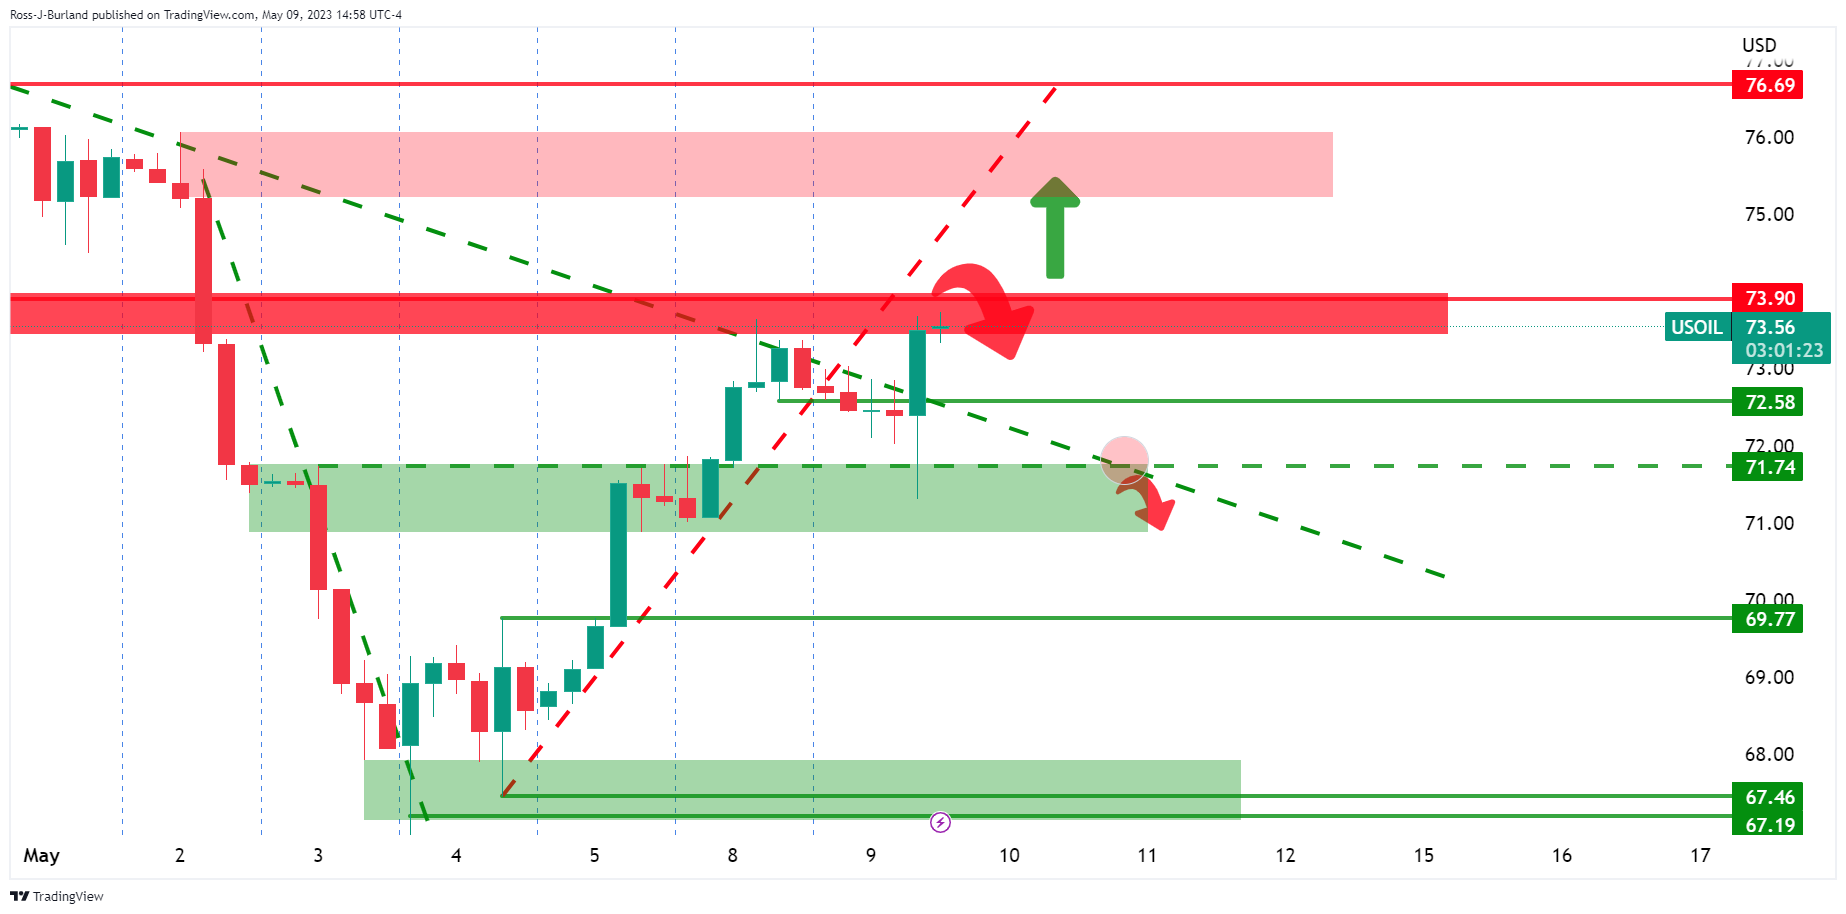
The structure sees the price needing a break of $73.90 to the upside of a break of the $71.70s to the downside in order to resume the broader downtrend.